Month-end depends on copy, paste and crossed fingers
People spend hours collecting files, updating formulas, checking links and rebuilding the same report every period.
What needs to changeAutomate the recurring work instead of rebuilding it.
StrategiQ Analytics builds practical Power BI dashboards that replace recurring spreadsheet work with reporting your team can use. Start with one report or grow into a wider solution, with clear ownership and handover.
New to Power BI? See what it could do for your business.
The dashboard is usually the visible part. Most difficult reporting environments fall into a few familiar patterns — and each one points to a different part of the process that needs fixing.
People spend hours collecting files, updating formulas, checking links and rebuilding the same report every period.
Critical rules have accumulated over years, with undocumented exceptions and calculations that only make sense to the person who built them.
ERP systems, databases, SharePoint, APIs and Excel all hold part of the picture, but nobody has joined them into a reliable reporting model.
Conflicting numbers, unclear definitions and fragile refreshes turn business intelligence into another thing the team has to reconcile.
Swipe, scroll or use the arrows. The point is not that every problem applies — it is that familiar symptoms usually point to a fixable process underneath.
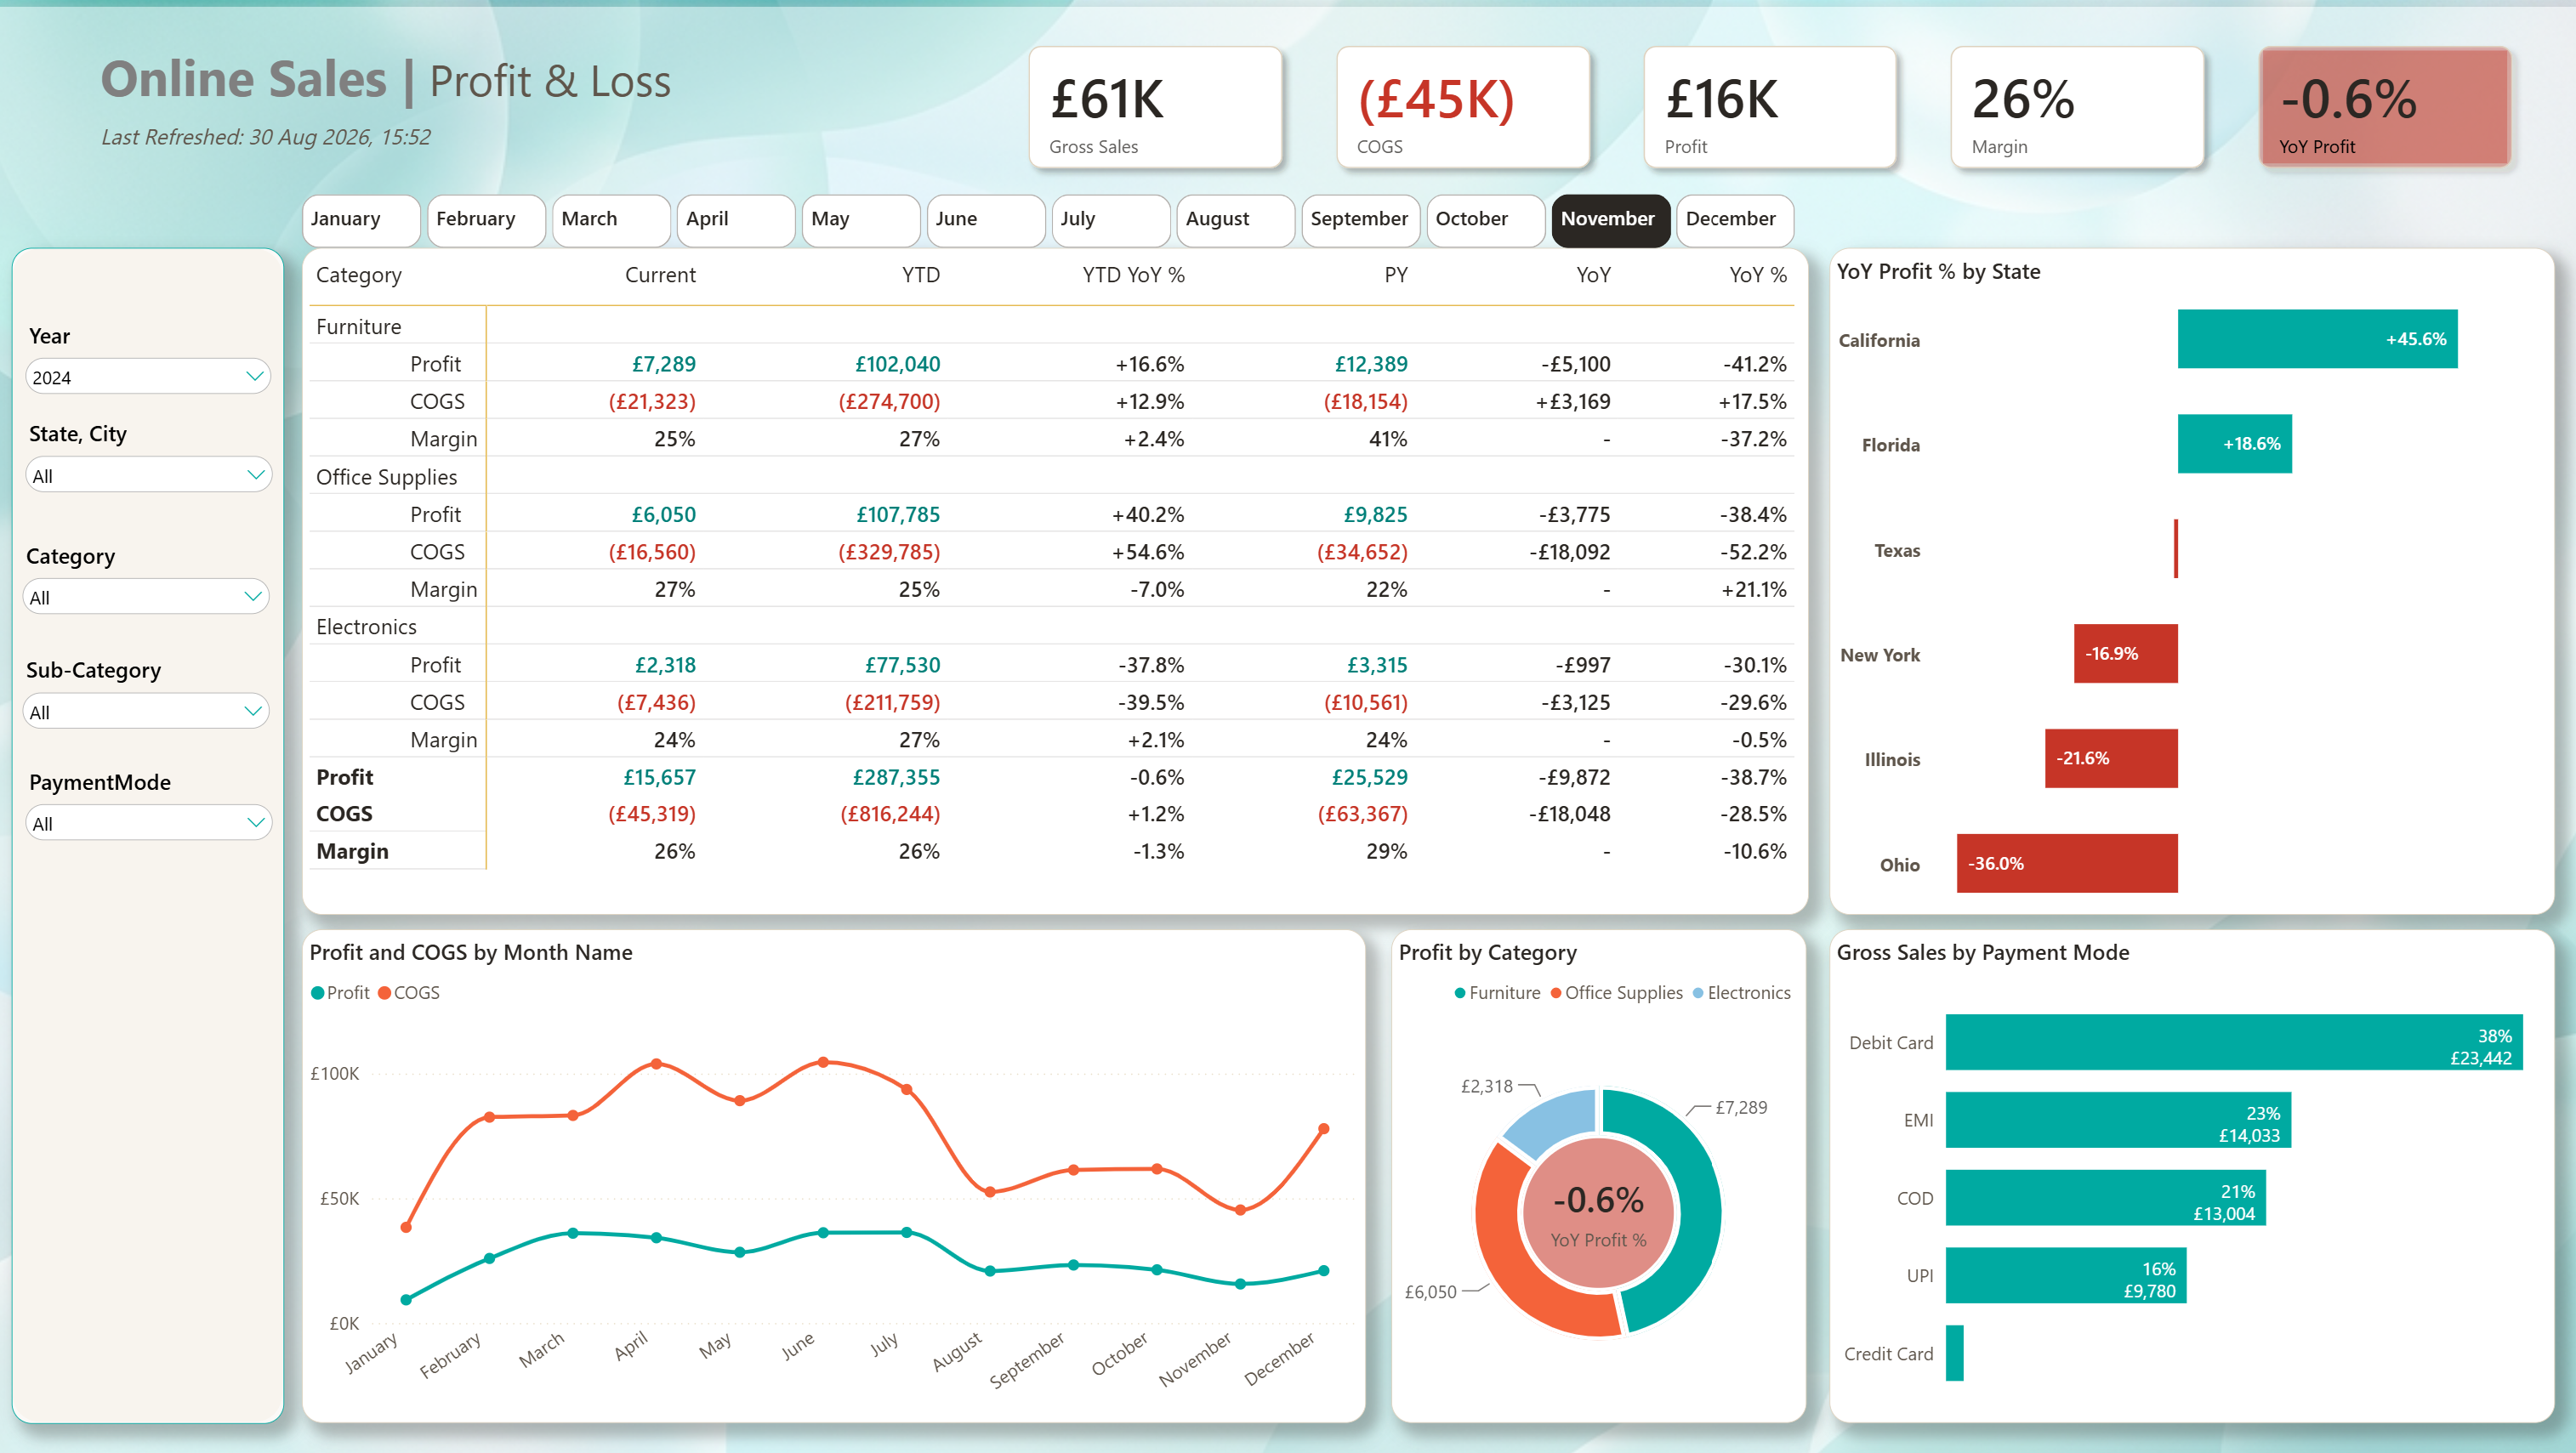
Portfolio visual recreated with non-confidential example data.
In an in-house role, StrategiQ Analytics' founder independently delivered the Power BI side of a complex P&L transformation — from understanding unfamiliar financial logic and locating source data through to deployment, handover and support.
Good BI starts with understanding the business process and the data underneath it. The visual layer comes after the foundations are right.
Map the process, the people using it, the business rules and the reason the existing reporting became painful.
Find the real sources, work through access and infrastructure, and connect to the data — even when the environment is awkward.
Move fragile spreadsheet logic into a structured, testable model designed around the decisions the business needs to make.
Deploy, document, explain and support the finished solution so your team is not dependent on us to keep it alive.
Engagements are scoped around the problem rather than forced into a fixed package. Start small when that is all you need; go deep when the complexity demands it.
A practical starting point for one weekly or monthly report, using Excel, CSV or another accessible source.
For teams that know the current process is a problem but need clarity on what to fix first.
For multi-source environments where reporting, infrastructure, security and business logic all need to work together.
A small specialist consultancy should not imitate a huge one. The advantage is direct access to the person solving the problem, faster decisions and less delivery overhead.
The person discussing the problem with you is also responsible for designing and building the solution.
Power BI is the platform. The objective is to remove wasted effort, improve trust in the numbers and make information easier to use.
Legacy systems, undocumented logic and strange source constraints are not reasons to delay the project — they are part of the project.
Clever is not the goal. The best solution is the one your organisation can understand, support and extend afterwards.
If the current reporting process is slow, fragile, confusing or simply no longer good enough, tell us how it works today. We can work out the technical route from there.